How to Know When to Exit a Stock: Signals That Matter
Published : November 26, 2025
Getting out of a stock is usually more challenging than getting into one. Most investors enter with an “exit” strategy; however, not very many actually understand how to sell at the right point.
Exit too soon → you will limit your profits Exit too late → you will likely lose some or all of your profits
The difficulty is distinguishing the meaningful signals from the temporary price noise of stock markets. Research shows that investors typically underperform, not necessarily because they make bad stock selections, but due to several behavioural biases, such as loss aversion, overconfidence, and mass-chasing behaviour.
This guide breaks down various research-supported signals that can assist you in determining when to exit a stock by way of two or more complementary signals, across a range of market data, company fundamentals, and behavioural properties. By consistently utilising the signals, you will undermine emotional decisions and improve your long-term portfolio returns.
Why Exiting a Stock Is Difficult
Selling a stock can be incredibly difficult, perhaps surprisingly sometimes, even for the experienced investor. Fear and hope typically drive the decision more so than reason.
Here is Ramesh’s story: he purchased shares in a technology company at ₹1,200. When the price dropped to ₹900, he did not sell, hoping the price would recover. Several months later, the price falls to ₹650. Clearly, Ramesh was anchored to the price at which he purchased the shares.
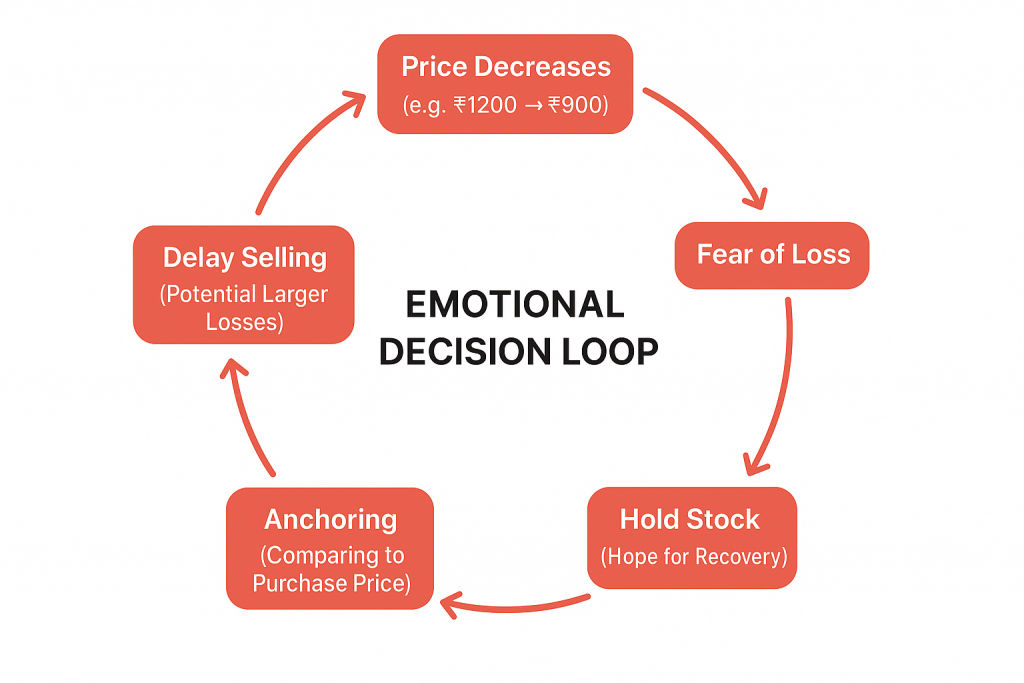
Investors often go through a psychological cycle – an Emotional Decision Loop – in which they hold a stock that is not performing.
Price Decreases → Fear of Loss
Hold Stock → Hope for Recovery
Anchoring → Comparing to Purchase Price
Delay Selling → Potential Larger Loss(s).
It is important that we work to escape these loops through acknowledgement of the biases, like loss aversion, anchoring, and overconfidence. It is all about learning to be aware of these and other types of behaviours to make good exit decisions that are rational and timely.
1. How to Know When to Exit a Stock: Weakening Fundamentals to Watch
The most consistent indicators of enduring performance in the stock market have usually been revenue, profit margin, debt, market share, and innovation pipeline. Studies have revealed that when the fundamentals of a company are on a downward spiral, then chances are high that this company will not perform well in the long term.
Key Signals:
The revenue growth declined in several quarters.
Margin profit margins decrease steadily.
The debts increase without a strategic reason.
There is a loss in market share because of increased competition.
Delays in product launches or R&D progress
Management advice becomes risk-averse.
Comparison of Fundamentals:
Fundamental Metric
Healthy Company
Weakening Company (Exit Signal)
Revenue Growth
Consistent upward trend
Slowing over multiple quarters
Profit Margins
Stable or improving
Shrinking consistently
Debt Levels
Manageable, strategic
Rising without justification
Market Share
Stable or growing
Declining due to competition
Product Pipeline
On schedule, innovative
Delays in launches or R&D
Management Guidance
Confident & positive
Becomes cautious or conservative
Temporary fluctuations are normal, but sustained deterioration often signals that a stock is losing its long-term growth potential.
2. When You Find a Better Opportunity
The concept of opportunity cost is quite important when it comes to managing your portfolio. Transferring your capital from laggards or names with low momentum to more promising growth stocks can make a significant difference in long-term returns. I will expand on the above point in an Indian context.
Why This Matters
Markets evolve, leadership shifts across sectors
Over time, leadership will rotate within the market; winners today may underperform tomorrow, and emerging sectors may rise to prominence.
If you keep your capital tied up in underperformers, you are likely missing out on growth potential.
Capital locked in stagnant stocks limits growth
In investing, even if a stock is not underperforming, holding onto a stock when better opportunities present themselves is a “hidden cost.”
By freeing up capital and redeploying it, you can increase your return potential while also improving the quality of your portfolio.
Moving to companies with better earnings visibility improves portfolio quality
Companies with clearer earnings trajectories (e.g., with embedded structural growth, favourable regulation, or secular tailwinds) provide more predictable upside limitations and benefits.
Additionally, this shift simplifies risk as you shift to higher-conviction, high-growth areas.
Strategic exits ensure adaptability
Regularly reassessing and pruning your portfolio helps you stay aligned with macro trends, sector rotations, and emerging themes rather than being anchored in outdated bets.
Examples of Shifts Creating Opportunity in India
Here are a few real-world or observed sector shifts in India, showing how opportunity cost plays out:
From Old Infrastructure / Capex to Consumption & Electronics
In areas like electronics (especially linked to the PLI scheme) and infrastructure are now among high-conviction opportunities.
As India pushes “Make in India” for electronics, companies in hardware manufacturing or component ecosystems may benefit.
Meanwhile, more capital is flowing into mature infrastructure names (Larsen & Toubro, etc.) as capex picks up.
Rotation from Overvalued IT / Financials to Healthcare, Energy, and Infrastructure
Some strategists recommend reducing exposure to very expensive sectors like IT & financials and rotating into pharma, infrastructure, and energy.
This is particularly compelling when valuations in the high-growth names have run up, and other sectors are becoming structurally more attractive.
Export-Driven Growth
With global supply-chain realignment, export‑oriented sectors (such as chemicals or pharma) are becoming more important.
Indian companies that export (or are global-facing) may benefit more, so moving from purely domestic plays to export plays could be attractive.
3. When the Stock Becomes Overvalued
Based on the behavioural research, it is believed that investors will always have the tendency to hold on to the overvalued stocks primarily because of the disposition effect or the tendency to hold on to their winners. A stock is overvalued when the increase in its price is faster than the shifts in the underlying fundamentals.
Signs of Overvaluation:
P/E ratio is much higher than the industry.
Revenue/profit level is not improving, and price rallies.
Giving up valuation helps to reduce profits and minimise downside risk when in a falling market. Previous experiences show that current positions founded on overvaluation points will significantly enhance risk-adjusted returns.
Also in the ET Markets list of overvalued names: forward P/E ~45x, well above its historical averages.
This suggests that investors were paying a high premium far in advance, possibly banking on growth that may not materialise as expected.
4. When Your Financial Goal Is Reached
Objective-driven investing, a principle supported by behavioural finance, focuses on investment decisions based on personal financial objectives instead of market noise. Once a set investment goal is accomplished, exiting or rebalancing the investment is a consistent, disciplined choice instead of an emotional reaction based on short-term price trends.
Benefits of Objective-driven Exits
Adds discipline to investing
You maintain a focus on your goals without succumbing to emotion-driven choices, following a path that resonates with your life objectives.
Strengthens long-term financial planning
In making investment decisions, factors for decision-making are based on goals, not conjecture.
Reduces exposure to avoidable risk
When you hit a goal, you can protect the profits by moving some funds to more stable assets.
Keeps decisions aligned with personal milestones
Helps investors maintain clarity on what matters most—rather than being distracted by market movement.
Common Financial Goals in India
Investors often tie their portfolio decisions to specific life milestones. Examples include:
Buying a Home
A lot of Indians accumulate a down payment through savings in either equity, mutual funds, or hybrid products.
Upon receiving the necessary down payment corpus, individuals may choose to exit from those riskier investments and reallocate that capital into safer asset classes (i.e., fixed deposits or debt funds).
Funding Education for Children
Parents often start investing early in equities or mutual funds to fund school or college fees 10 to 15 years ahead.
Systematic exits are timed when the education goal is approaching, protecting the capital from market volatility.
Retirement Planning
Long-term investors may track a retirement corpus target.
As they approach retirement age, a gradual exit from high volatility instruments and a shift to fixed income or annuity products helps safeguard accumulated wealth.
Other Goals
Wedding expenses, medical emergencies, or starting a business, any goal with a known timeline can be tied to systematic portfolio exits.
5. When the Investment Thesis No Longer Holds
An evaluation of stock performance is pegged on a clear investment thesis. Research indicates that when you constantly check your thesis, you can realise when a business is performing poorly at an early stage, cut down exposure to a company that is going down, and do not rely on archaic beliefs.
Signs Your Thesis is no longer valid
Growth plans failed or were slow.
Regulatory changes affected margins or other aspects of the business model.
The strategy of the company changed with shifts in leadership.
The market leadership position of the company was compromised by its competitors.
Important revenue drivers were weak.
Profitability was the highest, or cash flow was decreasing.
Examples of Broken Thesis
Some of these circumstances in which an investment thesis can break down include:
Delayed expansion plans: A firm had expansion plans to release new products or venture into new markets, but it was slowed down in expansion, hindering the growth of revenue.
Regulatory effect: This occurred due to a reduction in projected margins of an already growth-heavy business due to a change in laws or tax changes.
Leader changes: The shift in the management team in the pre-planned growth lever’s strategic direction, which was originally in the growth lever.
Competition: New competition or substitutes have lost market share faster than was expected.
Decreasing revenue streams: Large products or services that were generating earnings started stagnating or losing performance.
Checklist: Identifying a Broken Thesis
Signal / Trigger
What to Monitor
Growth plan issues
Missed targets, delayed launches, or stagnating expansion
Regulatory headwinds
Policy changes affecting margins or revenue potential
Leadership risk
Key management exits, strategy shifts, or governance changes
Competitive pressure
Market share loss, pricing pressure, or new disruptive entrants
Core business weakening
Declining sales in main products or geographies, falling margins
Financial stress
Rising debt, shrinking free cash flow, or worsening working capital
Periodic reviews ensure you hold only those stocks aligned with your long-term strategy, rather than following temporary trends.
6. When Technical Signals Indicate Weakness
Technical analysis is used as a supplement to fundamental analysis to identify an early warning of diminishing momentum. In a research study, technical signals were used with the fundamental signals to avoid the risk of exiting a trade prematurely.
Common Technical Exit Signals are:
Breakdown below the long-term support levels.
Head and shoulders (bearish reversal formations), Double top.
Regular low highs and low lows.
Volume is reducing, having an overall market strength.
Technical indicators particularly come in handy when it comes to the early reversal of trends and the guarding of accumulated profits in case of a correction.
Building a Strong Exit Strategy
Utilising an organised exit strategy will help you stay rational and systematic and minimise your instinctive nature, improving your portfolio for sustainable performance over time. If you clearly define how and when you will exit, your likelihood of sticking to your plan in an active market environment increases.
Key Components of an Exit Strategy
Clear Target Price or Expected Return
Define realistic exit points (based on valuation, growth, or return goals).
These targets act as guardrails to avoid being swayed purely by short-term exuberance.
Fundamental or Technical Triggers
Use fundamental triggers: earnings misses, deteriorating cash flows, rising debt, management changes, etc.
Use technical triggers: stop‑loss orders, trailing stops, or chart-based exit points.
Regular Portfolio Review
Conduct periodic reviews (e.g., annually) to assess whether holdings still align with your thesis and risk profile.
Revisit performance, valuation, and strategy in a structured way.
Rebalancing Rules for Portfolio Health
Define thresholds for when to rebalance: e.g., if your equity allocation drifts ±X% from target.
Rebalance by trimming overexposed winners and adding to underweighted areas.
Contingency Plan for Market Stress
Plan what to do in sharp corrections, e.g., partial profit booking, raising cash, or using stop-losses.
Maintain capital reserves or an emergency fund so you’re not forced into fire‑sales.
Exit Strategy Checklist
Exit Strategy Element
Questions to Ask Yourself
Target / Expected Return
What return or price would make me comfortable exiting? Is this grounded in valuation or growth?
Fundamental Trigger
Have earnings, cash flows, or business risks changed? Are management or competitive dynamics shifting?
Technical Trigger
Should I set a stop‑loss / trailing stop? What chart levels are important (support/resistance)?
Review Frequency
How often will I review my portfolio? What metrics (P/E, ROE, debt) will I track?
Rebalance Threshold
What drift range is acceptable in my asset allocation (e.g., ±5%) before I rebalance?
Stress Scenario Plan
What’s my fallback if markets crash or a key holding tanks? Do I have cash / liquid assets set aside?
Key Takeaways
Leaving a stock is equal to going into one. A disciplined exit strategy:
Protects capital
Preserves profits
Minimises emotional decision-making.
Conforms to long-term financial objectives.
By observing the foundations, the values, the market state, and your own objectives carefully, you can make wise choices and safely get out of it with the help of research.
Intelligent exits will make investments less risky, maintain the stability of portfolios, and achieve their financial results on time.
Remember: Investing is not just about owning the right stocks to achieve success. It is the knowledge of when to sell them.
Plan Smarter. Exit Smarter. Take control of your portfolio with Rmoney India. Get evidence-based information, up-to-date market data and customised advice, and develop a disciplined exit plan that safeguards your money and optimises long-term profits.
1. How often should I review my stocks for potential exits? At least quarterly, or whenever significant earnings announcements, sector shifts, or company-specific news occur. Regular reviews ensure your strategy stays aligned with market conditions and your financial goals.
2. Should I sell during short-term dips? No. Short-term volatility often doesn’t reflect a company’s long-term fundamentals. Evaluate whether the underlying thesis is still valid before making any decision.
3. Can technical indicators alone determine exits? No. Technical indicators (like moving averages or stop-loss levels) are useful for timing but should complement fundamental analysis and your financial goals, not replace them.
4. Is partial selling a good strategy? Yes. Selling a portion of your holdings locks in gains while keeping exposure to potential future growth. It balances risk and opportunity effectively.
5. How do financial goals influence exit decisions? Exiting based on life goals—such as buying a home, funding education, or retirement planning—ensures disciplined decision-making rather than reactive choices driven by market noise.
6. How do I set stop-loss levels when exiting stocks?
Define a percentage-based or value-based threshold based on your risk tolerance.
Combine stop-loss rules with your overall investment thesis to avoid being forced out during temporary market fluctuations.
7. Should I sell underperforming stocks immediately? Not necessarily. First, identify whether the underperformance is due to short-term market volatility or a broken investment thesis. If fundamentals are deteriorating, an exit may be prudent; otherwise, patience could allow recovery.
8. How do macroeconomic trends affect exit decisions? Economic factors like interest rates, inflation, or policy changes can impact sectors differently. Exits may be timed to protect gains or reallocate capital toward sectors likely to benefit from macro trends.
9. What role does portfolio diversification play in exit timing? Diversification reduces the impact of any single investment underperforming. A well-balanced portfolio may allow you to hold longer in some positions while exiting weaker or overvalued holdings without jeopardising overall performance.
10. Can automated alerts help me exit stocks effectively? Yes. Alerts for price targets, stop-losses, or fundamental changes help you act quickly without constant monitoring. They should be used as part of a structured exit strategy, not as the sole basis for decisions.
Disclaimer: The information provided in this blog is for educational and informational purposes only and should not be considered as investment advice or a recommendation to buy or sell any securities. Please consult a SEBI-registered investment advisor before making any investment decisions.
I have expertise in simplifying complex concepts around trading and investing into clear, practical insights. At RMoney, I write on trading, equity markets, derivatives, and long-term investing to help readers make informed financial decisions. My writing is focused on delivering clarity and confidence to investors at every stage of their journey.
 Stock Trading
Now trade in ₹9 Per Order or ₹ 999 Per Month Plans.
Stock Trading
Now trade in ₹9 Per Order or ₹ 999 Per Month Plans.
 Future & Options
Access F&O contracts with advanced tools for hedging and speculation.
Future & Options
Access F&O contracts with advanced tools for hedging and speculation.
 Currency Trading
Trade in major currency pairs and manage forex exposure efficiently.
Currency Trading
Trade in major currency pairs and manage forex exposure efficiently.
 Commodity Trading
Diversify Trading with MCX & NCDEX by Trading in Gold, Silver, Base Metals, Energy, and Agri Products.
Commodity Trading
Diversify Trading with MCX & NCDEX by Trading in Gold, Silver, Base Metals, Energy, and Agri Products.
 Margin Trading Funding
Boost your buying power with upto 5X, Buy now Pay Later
Margin Trading Funding
Boost your buying power with upto 5X, Buy now Pay Later
 Algo Trading
Back test, Paper Trade your logic & Automate your strategies with low-latency APIs.
Algo Trading
Back test, Paper Trade your logic & Automate your strategies with low-latency APIs.
 Trading View
Leverage Trading View charts and indicators integrated into your trading platform.
Trading View
Leverage Trading View charts and indicators integrated into your trading platform.
 Advanced Options Trading
Execute multi-leg option strategies with precision and insights.
Advanced Options Trading
Execute multi-leg option strategies with precision and insights.
 Stock Lending & Borrowing
Earn passive income by lending stocks securely through SLB.
Stock Lending & Borrowing
Earn passive income by lending stocks securely through SLB.
 Foreign Portfolio Investment
Enable NRIs and FPIs to invest in Indian markets with ease and compliance.
Foreign Portfolio Investment
Enable NRIs and FPIs to invest in Indian markets with ease and compliance.
 IPO
Invest in upcoming IPOs online with real-time tracking and instant allotment updates.
IPO
Invest in upcoming IPOs online with real-time tracking and instant allotment updates.
 Direct Mutual Funds
0% Commissions by investing in more than +3500 Direct Mutual Fund Scheme.
Direct Mutual Funds
0% Commissions by investing in more than +3500 Direct Mutual Fund Scheme.
 Corporate FDRs
Earn fixed returns with low-risk investments in high-rated corporate fixed deposits.
Corporate FDRs
Earn fixed returns with low-risk investments in high-rated corporate fixed deposits.
 Stocks SIPs
Build long-term wealth with systematic investment plans in top-performing stocks.
Stocks SIPs
Build long-term wealth with systematic investment plans in top-performing stocks.
 Bonds & NCDs
Access secure, fixed-income investments through government and corporate bond offerings.
Bonds & NCDs
Access secure, fixed-income investments through government and corporate bond offerings.
 Depository Services
Safely hold and manage your securities with seamless Demat and DP services with CDSL.
Depository Services
Safely hold and manage your securities with seamless Demat and DP services with CDSL.
 Journey
Tracing our growth and milestones over time.
Journey
Tracing our growth and milestones over time.
 Mission & Vision
Guided by purpose, driven by long-term vision.
Mission & Vision
Guided by purpose, driven by long-term vision.
 Why RMoney Platform
Smart, reliable platform for all investors' needs.
Why RMoney Platform
Smart, reliable platform for all investors' needs.
 Management
Experienced leadership driving strategic financial excellence.
Management
Experienced leadership driving strategic financial excellence.
 Credentials
Certified expertise with trusted industry recognition.
Credentials
Certified expertise with trusted industry recognition.
 Press Release
Latest company news, updates, and announcements.
Press Release
Latest company news, updates, and announcements.
 Testimonials
Real client stories sharing their success journeys.
Testimonials
Real client stories sharing their success journeys.
 7 Reasons to Invest
Top benefits that make investing with us smart.
7 Reasons to Invest
Top benefits that make investing with us smart.
 SEBI Registered Research
Trusted insights backed by SEBI-compliant research.
SEBI Registered Research
Trusted insights backed by SEBI-compliant research.
 Our Technology
Advanced tools enabling efficient online trading.
Our Technology
Advanced tools enabling efficient online trading.
 Calculators
Access a suite of smart tools to plan trades, margins, and returns effectively.
Calculators
Access a suite of smart tools to plan trades, margins, and returns effectively.
 Margin Calculator
Instantly check margin requirements for intraday and delivery trades.
Margin Calculator
Instantly check margin requirements for intraday and delivery trades.
 MTF Calculator
Calculate MTF funding cost upfront to ensure full transparency before placing a trade.
MTF Calculator
Calculate MTF funding cost upfront to ensure full transparency before placing a trade.
 Brokerage Calculator
Know your exact brokerage charges before placing any trade.
Brokerage Calculator
Know your exact brokerage charges before placing any trade.
 Market Place
Explore curated investment products and trading tools in one convenient hub.
Market Place
Explore curated investment products and trading tools in one convenient hub.
 RMoney Gyan
Enhance your market knowledge with expert blogs, videos, and tutorials.
RMoney Gyan
Enhance your market knowledge with expert blogs, videos, and tutorials.
 Performance Tracker
Track our research performance with full transparency using our performance tracker.
Performance Tracker
Track our research performance with full transparency using our performance tracker.
 Feedback
Share your suggestions or concerns to help us improve your experience.
Feedback
Share your suggestions or concerns to help us improve your experience.
 Downloads
Access important forms, software, and documents in one place.
Downloads
Access important forms, software, and documents in one place.
 Locate Us
Find the nearest RMoney branch or service center quickly.
Locate Us
Find the nearest RMoney branch or service center quickly.
 Escalation Matrix
Resolve issues faster with our structured support escalation process.
Escalation Matrix
Resolve issues faster with our structured support escalation process.
 Back Office
Log in to view trade reports, ledger, and portfolio statements anytime.
Back Office
Log in to view trade reports, ledger, and portfolio statements anytime.
 Account Modification
Update personal or bank details linked to your trading account.
Account Modification
Update personal or bank details linked to your trading account.
 Fund Transfer
Transfer funds instantly online with quick limit updation to your trading account.
Fund Transfer
Transfer funds instantly online with quick limit updation to your trading account.
 Bank Details
View our registered bank account details for seamless transactions by NEFT, RTGS or IMPS.
Bank Details
View our registered bank account details for seamless transactions by NEFT, RTGS or IMPS.
 RMoney Quick Mobile App
Trade on-the-go with our all-in-one mobile trading app.
RMoney Quick Mobile App
Trade on-the-go with our all-in-one mobile trading app.
 RMoney Quick login
Quickly access your trading account through the RMoney Quick web-based trading.
RMoney Quick login
Quickly access your trading account through the RMoney Quick web-based trading.
 RMoney Rocket Web Version
Experience powerful web-based trading with advanced tools for algo traders.
RMoney Rocket Web Version
Experience powerful web-based trading with advanced tools for algo traders.
 RMoney Rocket Mobile Version
Trade anytime, anywhere with our feature-rich mobile trading platform.
RMoney Rocket Mobile Version
Trade anytime, anywhere with our feature-rich mobile trading platform.