
Support and Resistance Explained: The Basics of Price Action Trading
By: Amit Chauhan | Date : Sep 30, 25
When you start trading in stocks, foreign exchange, commodities or other markets. You will often hear people talk about support and resistance in various contexts. These are two of the simplest terms used in technical analysis and price action trading. If you really understand these two ideas well you will get much better at spotting good times to enter and exit trades as well as managing risks.
What is Support and Resistance?
Support is a price point or area where there is enough buying interest to stop the price from dropping any lower. It functions like a “base.” Prices often get close to it and then rise again.
Resistance is the opposite of support. It is a point or area where there is enough selling interest to prevent the price from rising further. It’s similar to a ‘roof’ that caps the market’s upward move. Prices tend to reach that point but are often pushed lower.
These levels are not enchanted. Rather, they represent places where human emotions regarding the market, combined with the history of price movement and the equilibrium of supply versus demand, join in the price behavior. Everybody remembers all the significant points that the price has reversed. If enough orders accumulate at a certain price level, it will affect the price movement.
Why Are They Important?
There are several reasons support and resistance levels are important in the context of price action trading:
Entry and exit levels: These levels help identify where to enter a trade (long position near support) and exit a trade, or book profit (near resistance)
Risk management: A smart trader always places stop-loss orders just below support or just above resistance. If the price breaks these key levels, it signals that the market may move against the trade. Placing stop-losses around these levels keeps your risk limited, logical, and disciplined.
Trend Confirmation and Reversal Signals: A breakout above resistance could indicate a trend towards bullish; likewise, a breakout below support could indicate bearish continuation or reversal.
Psychological Importance: Humans tend to think about whole numbers (i.e. 100.00 on a stock, and 1.2000 for a forex) as important barriers. These are usually treated as support/resistance in the market.
How to Identify Support and Resistance
Support and resistance levels are not always completely horizontal lines, and they are often “zones” or “areas.” Below are some of the principle ways traders identify them:
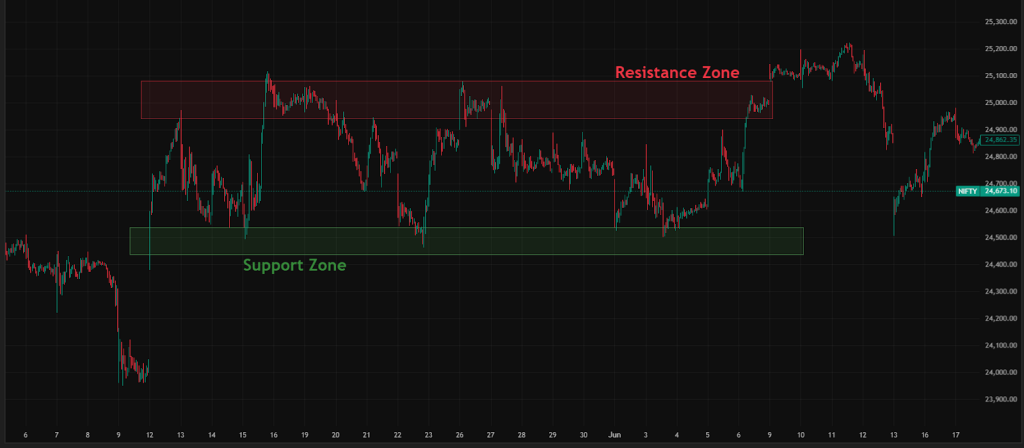
Support and Resistance Zone Example
| Method | How It Works / What to Look For |
| Swing Highs & Swing Lows | Identify past peaks (for resistance) and past lows (for support). If price reversed there before, these could again be zones where it reacts. |
| Historical Price Data | Levels tested multiple times in the past (price bounced off or got rejected multiple times) tend to be more reliable. |
| Trendlines / Channels | In trends, rising trend lines act as support (in uptrend) and descending trend lines as resistance (in downtrend). And channels (parallel lines) show repeating support/resistance zones. |
| Moving Averages / Dynamic Levels | Some moving averages (like 50-day, 200-day) tend to act as support/resistance. These aren’t static, they move with price. |
| Fibonacci Retracement Zones | After a big move up or down, the retracement levels (38.2%, 50%, 61.8% etc.) are often watched as support/resistance zones. |
| Volume Clusters / Price/Time Zones | Whenever there are large amounts of volume at certain price levels or price remains for long periods in certain price ranges, those price areas tend to be significant to future behavior. |
Key Characteristics of Good Support/Resistance Levels
Not all support and resistance zones are created equal, meaning that some are stronger and more reliable than others. What makes up the “better” ones?
Multiple Price Touches: Price has approached or entered this zone on multiple occasions. The more frequent areas, the more powerful it is.
Timeframe: Levels which are seen at a higher timeframe (daily and weekly) are more important than levels which are seen at a very short timeframe (minutes).
Volume confirmation: Strong reversals or breaks on volume around a level add weight to the reversal.
Proximity to round numbers or psychological levels: As stated, mental levels like 50.00, 100.00 etc. are perceived a bit different.
Clear price action signals at these levels, ie, pin bars, engulfing candles, double tops/bottoms etc when seen at s/r zones this provide confirmation.
How Support Becomes Resistance (and Vice Versa)
In price action trading a key idea is that when the price falls below a support level that same level might be checked again later and turn into resistance if the price rises above it. Similarly, if the price breaks above a resistance level that level can then act as support. The idea comes from the fact that players’ mindsets and the way orders are placed shift when a breakout happens.
For instance, imagine a stock that has often risen back up from ₹500 which is its support level. If the price drops below ₹500 when it tries to go up again it might face resistance at ₹500 due to selling pressure. When traders can spot this change it helps them get ready for when the price goes back to test that level after breaking through it.
Trading Strategies Using Support & Resistance
Here are some common ways traders use support and resistance in actionable trading setups:
Bounce Trades
Wait for price to approach a support (in uptrend or in range) or resistance (in downtrend or in range), see price action confirmation reversal (e.g. hammer, doji, pin bar), then enter with stop-loss just beyond the support/resistance. The idea: trade the bounce.
Breakout Trades
A convincing break of resistance (for a long) or a break below support (for a short) signals a potential strong move. The entry can be on the breakout, or after a retest of the broken level (the flip). A proper stop-loss should be placed to protect against a false breakout, and volume aids the confirmation.
Trading Ranges
Prices tend to bounce back and forth between support and resistance in a horizontal range. Traders usually buy at (or near) support and sell at (or near) resistance until a breakout occurs. This requires perspective and discipline, and to be aware that the range could eventually fail.
Trend Trading with S/R Retests
In trending markets (up-trending or down-trending), the pullbacks of the trend will usually find support (in an up-trending market) or resistance (in a down-trending market) at past levels (previous swing high ↔ support in an up-trending market). The retest of levels to find support or resistance can provide lower-risk entries in the direction of the trend.
Common Mistakes & Pitfalls
Although support and resistance are fairly simple concepts, many traders abuse them or make the same errors:
- Drawing too many lines, especially minor ones, which clutters the charts and can diminish clarity. Focus on important zones.
- Treating support or resistance levels as exact price points instead of zones. A level may not be the exact price point; price frequently “wicks” through or may trade through the level then come back.
- Ignoring volume or other confirmation: price may “bounce off” a level, but it may be “weak” or a false “breakout”.
- Risk control failures: entering trades without strict stop-loss, or taking too large positions expecting large reversal.
- Not paying attention to higher timeframe levels: what looks strong on a 5-min chart might be insignificant on daily.
Putting It All Together: A Practical Approach
Here is a step-by-step process you can implement with support and resistance in price action trading. This approach works especially well for those using RMoney or platforms/tools that allow for the chart and alerts.
- Start Higher Time Frame (HTF) Scan
You want to draw lines from daily or 4-hour charts for major swing highs and lows and keep a distance of a few candles between before drawing zones of support and resistance tested multiple times. - Mark Key Levels
Use daily or 4-hour charts to identify important high and low points in price movements. Look for areas of support and resistance that have been proven several times. - Look for Confluence
Based on historical reversals, volume clusters, round numbers, moving averages, etc. For instance, watch levels where price is strongly rejected or where you see long wicks. - Wait for Price Action Confirmation
When the price gets close to a level, don’t jump in immediately. Wait for a candlestick or bar that shows rejection (pin bar, hammer, engulfing, etc.). Avoid chasing. - Plan Stop-Loss and Target
Place stop-loss just beyond the level (a bit outside the zone). Targets: next key level (resistance if you long from support, or support if short from resistance), or using risk-reward ratio (e.g., 1:2 or better). - Monitor for Role Reversals
If price breaks a level significantly, observe if that level flips its role (support ↔ resistance) when price retests. That retest can often provide a good entry with better reward/risk. - Risk Management
Never risk too much of your capital on one trade. Use proper position sizing. Even good setups fail sometimes.
Example:
Let’s go through a theoretical example to illustrate this.
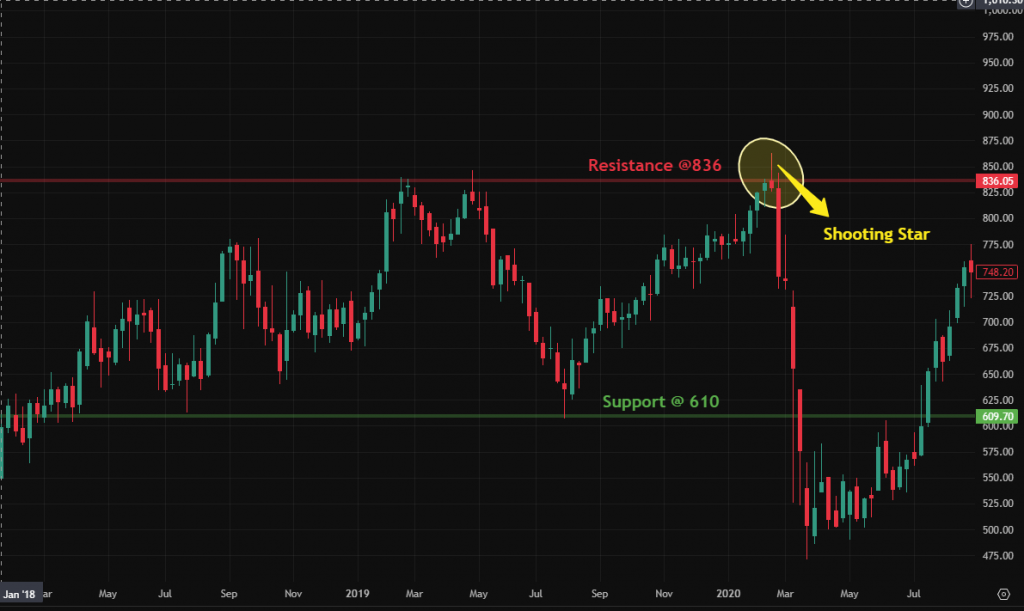
Let’s say stock XYZ had been trading from ₹610 to ₹836 for the past several months. The price has bounced a few times off ₹610 (support) and has been rejected a few times at ₹836 (resistance).
Now the price is moving back up toward ₹836. You wait for a signal of reversal (e.g., a shooting star) near ₹836 and if you see that signal, you may decide to short (sell) with your stop-loss just above the shooting star high (around ₹865) and then target the support of ₹610.
Remember to always check the larger story (the trend of the market, higher time frames) to see if it is trending up or down as trading with the trend is generally beneficial.
Support & Resistance and Price Action: A Quick Glossary of Key Terms
| Term | Meaning |
| Price Action | The movement of a security’s price over time, shown via charts & bars/candles; reading patterns without relying heavily on indicators. |
| Swing High / Swing Low | A local peak or trough in price action where trend momentarily reverses direction. |
| Breakout | When price moves past resistance (upward) or below support (downward) and stays past it. |
| Retest / Pullback | After breaking a level, price returns to it to test if it holds (flip zone) before continuing |
| Zone / Area | Refers to an approximate area rather than an exact line: supports/resistances are often fuzzy. |
Final Thoughts
The foundation of any smart trader is support and resistance. They give structure to what otherwise would be chaotic price movement: recognizing where price is likely to stall, bounce, or break out.
However, no concept is foolproof. You need discipline, patience, and consistent risk management. Always check for confirmation, use stop losses, and respect the larger trend.
If you want assistance putting it into action, RMoney is here for you. Whether you want to identify good support and resistance zones, set up alerts, or refine your trading plan based on price action, reach out to RMoney to help you step-by-step in trading smarter, reducing your mistakes, and growing your confidence.
Table of content
Categories
Open Demat Account 


Related Posts
-
How can stop loss improve your trading returns?
Even the most profitable trades can result in terrible losses for most of the stock...
-

Learn Amazing Facts about Financial Market
What is Investment? The money we earn or our monthly income is partly spent on...
-

Why You Should Focus On Improving Your Dividend Income?
Why do we invest in stocks? Is it only to gain out of the appreciation...
-

Your Guide to Difference between Demat and Trading Account
We have often noticed people getting confused between a Demat Account and a Trading Account...


Filing Complaints on SCORES (SEBI) – Easy & Quick
- Register on SCORES Portal (SEBI)
- Mandatory details for filing complaints on SCORES:
- Name, PAN, Address, Mobile Number, E-mail ID
- Benefits:
- Effective Communication
- Speedy redressal of the grieva`nces

IT'S TIME TO HAVE SOME FUN!
Your family deserves this time more than we do.
Share happiness with your family today & come back soon. We will be right here.
Investment to ek bahana hai,
humein to khushiyon ko badhana hai.
E-mail
askus@rmoneyindia.com
Customer Care
+91-9568654321


Trade Endlessly with
RMoney
Deep Discount Brokerage Plan
At 999/Monthly
- Dedicated round the clock Advisory Support
- High performance in depth research
- Save more than ₹10,000 brokerage Per Month
- Ultra fast trading app