India VIX Explained: A Complete Guide to India’s Volatility Index
Post Date : November 4, 2025

Markets often switch between calm and chaos. Sometimes, indices like Nifty 50 and Bank Nifty hardly move, staying in a narrow range, but on certain days they swing sharply within minutes. For traders and investors, it’s important to measure this uncertainty—and that’s exactly what India VIX, also known as the volatility index or fear gauge, does.
In this guide, we’ll explain India VIX in simple terms: what it is, how it’s calculated, what different levels mean, and how traders can actually use it.
What is India VIX?
India VIX stands for India Volatility Index, introduced by the National Stock Exchange (NSE) in 2008. It measures the expected volatility of the Nifty 50 index over the next 30 calendar days, based on option prices.
In simpler words:
- A high VIX means the market expects bigger price swings.
- A low VIX means the market expects stability.
The concept originated in the US, where the Chicago Board Options Exchange (CBOE) launched the original VIX in 1993. India’s version is an adaptation of that global benchmark.
How is India VIX Calculated?
The calculation is technical, but the idea is straightforward: India VIX takes option prices on the Nifty 50 and uses them to estimate market uncertainty.
Here are the key ingredients:
- Nifty Option Prices – Out-of-the-money (OTM) call and put option quotes from the order book.
- Expiry Periods – Near-month and next-month contracts, with exact time to expiry measured in minutes.
- Forward Index Level – Derived from Nifty futures to identify relevant strike prices.
- Risk-Free Rate – Interest rates (30–90 day government securities).
- Weighting System – Options near the current index level get more importance.
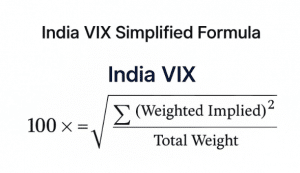
Simplified Formula:

Don’t worry if the formula looks complex, the key is that it transforms option pricing data into a single percentage number that reflects expected volatility.
How to Interpret India VIX
India VIX doesn’t say whether the market will go up or down. Instead, it measures how big the moves might be.
| VIX Level |
Market Condition (Technical) |
What It Implies |
| Below 15 |
Low Volatility / Range-bound Market |
Narrow price swings, stable environment, low hedging demand. |
| 15 – 25 |
Moderate Volatility / Healthy Liquidity Zone |
Typical market conditions with balanced risk–reward. |
| 25 – 35 |
High Volatility / Risk-Off Phase |
Larger price swings, increased uncertainty, demand for hedging rises. |
| Above 35 |
Extreme Volatility / Crisis Zone |
Disorderly market moves, liquidity stress, fear-driven trading activity. |
Example: During COVID-19 in March 2020, India VIX shot up to 86.6, reflecting extreme panic and unprecedented uncertainty.
Why India VIX Matters
- Market Sentiment Indicator
- A quick snapshot of whether traders are fearful or confident.
- Risk Management
- Helps investors know when to protect their portfolios with hedges.
- Options Pricing
- Higher VIX → Expensive option premiums.
- Lower VIX → Cheaper premiums.
- Trading Volatility Directly
- Since 2014, NSE has allowed VIX futures trading for those who want to hedge or speculate on volatility itself.
Practical Uses of India VIX
- Market Timing: Spikes in VIX often signal upcoming volatility. Cautious traders reduce exposure during these times.
- Options Strategies:
- When VIX is high → Selling options (collecting high premiums) may be attractive.
- When VIX is low → Buying options (cheap protection) may work better.
- Portfolio Hedging: VIX futures and options allow traders to shield their portfolios against sudden volatility.
- Event Risk Monitoring: Elections, budgets, or global events (like Fed decisions) often push VIX higher—alerting traders in advance.
Common Misconceptions about India VIX
High VIX means the market will fall.
Not always. VIX only measures magnitude of movement, not direction.
India VIX can go to zero.
Impossible. There’s always some uncertainty in markets.
It’s a perfect predictor.
No single indicator is foolproof—VIX works best when combined with other tools like charts, volumes, and fundamentals.
Historical Trends
- Normal Range: 15–25
- Extreme Events: Above 35 (rare, usually during crises).
- Case Study: In 2008’s global financial crisis, VIX hit record highs. In 2020, during COVID, India VIX reached 86+
These moments remind us that volatility is cyclical—it rises sharply in uncertain times and cools down when stability returns.
Key Takeaways for Traders & Investors
- India VIX = Gauge of expected market volatility over 30 days.
- High VIX = Expensive options, higher risk; Low VIX = Stable market, cheaper options.
- Useful for risk management, option pricing, and event-driven strategies.
- Works best as a context tool alongside technical/fundamental analysis.
Conclusion
India VIX is like a weather forecast for the stock market. It won’t tell you if the market will rise or fall, but it does tell you how stormy or calm things are likely to be. For traders and investors, this information is priceless—it helps protect capital, manage risk, and seize opportunities when others panic.
By keeping an eye on India VIX, you can trade smarter, stay prepared for volatility, and avoid being caught off-guard when markets swing sharply.

Stock Trading Now trade in ₹9 Per Order or ₹ 999 Per Month Plans.
Future & Options Access F&O contracts with advanced tools for hedging and speculation.
Currency Trading Trade in major currency pairs and manage forex exposure efficiently.
Commodity Trading Diversify Trading with MCX & NCDEX by Trading in Gold, Silver, Base Metals, Energy, and Agri Products.
Margin Trading Funding Boost your buying power with upto 5X, Buy now Pay Later
Algo Trading Back test, Paper Trade your logic & Automate your strategies with low-latency APIs.
Trading View Leverage Trading View charts and indicators integrated into your trading platform.
Advanced Options Trading Execute multi-leg option strategies with precision and insights.
Stock Lending & Borrowing Earn passive income by lending stocks securely through SLB.
Foreign Portfolio Investment Enable NRIs and FPIs to invest in Indian markets with ease and compliance.
IPO Invest in upcoming IPOs online with real-time tracking and instant allotment updates.
Direct Mutual Funds 0% Commissions by investing in more than +3500 Direct Mutual Fund Scheme.
Corporate FDRs Earn fixed returns with low-risk investments in high-rated corporate fixed deposits.
Stocks SIPs Build long-term wealth with systematic investment plans in top-performing stocks.
Bonds & NCDs Access secure, fixed-income investments through government and corporate bond offerings.
Depository Services Safely hold and manage your securities with seamless Demat and DP services with CDSL.
Journey Tracing our growth and milestones over time.
Mission & Vision Guided by purpose, driven by long-term vision.
Why RMoney Platform Smart, reliable platform for all investors' needs.
Management Experienced leadership driving strategic financial excellence.
Credentials Certified expertise with trusted industry recognition.
Press Release Latest company news, updates, and announcements.
Testimonials Real client stories sharing their success journeys.
7 Reasons to Invest Top benefits that make investing with us smart.
SEBI Registered Research Trusted insights backed by SEBI-compliant research.
Our Technology Advanced tools enabling efficient online trading.
Calculators Access a suite of smart tools to plan trades, margins, and returns effectively.
Margin Calculator Instantly check margin requirements for intraday and delivery trades.
MTF Calculator Calculate MTF funding cost upfront to ensure full transparency before placing a trade.
Brokerage Calculator Know your exact brokerage charges before placing any trade.
Market Place Explore curated investment products and trading tools in one convenient hub.
RMoney Gyan Enhance your market knowledge with expert blogs, videos, and tutorials.
Performance Tracker Track our research performance with full transparency using our performance tracker.
Feedback Share your suggestions or concerns to help us improve your experience.
Downloads Access important forms, software, and documents in one place.
Locate Us Find the nearest RMoney branch or service center quickly.
Escalation Matrix Resolve issues faster with our structured support escalation process.
Back Office Log in to view trade reports, ledger, and portfolio statements anytime.
Account Modification Update personal or bank details linked to your trading account.
Fund Transfer Transfer funds instantly online with quick limit updation to your trading account.
Bank Details View our registered bank account details for seamless transactions by NEFT, RTGS or IMPS.
How to Apply IPO Step-by-step guide to apply for IPOs using your trading account.
RMoney Quick Mobile App Trade on-the-go with our all-in-one mobile trading app.
RMoney Quick login Quickly access your trading account through the RMoney Quick web-based trading.
RMoney Rocket Web Version Experience powerful web-based trading with advanced tools for algo traders.
RMoney Rocket Mobile Version Trade anytime, anywhere with our feature-rich mobile trading platform.


