 Stock Trading
Now trade in ₹9 Per Order or ₹ 999 Per Month Plans.
Stock Trading
Now trade in ₹9 Per Order or ₹ 999 Per Month Plans.
 Future & Options
Access F&O contracts with advanced tools for hedging and speculation.
Future & Options
Access F&O contracts with advanced tools for hedging and speculation.
 Currency Trading
Trade in major currency pairs and manage forex exposure efficiently.
Currency Trading
Trade in major currency pairs and manage forex exposure efficiently.
 Commodity Trading
Diversify Trading with MCX & NCDEX by Trading in Gold, Silver, Base Metals, Energy, and Agri
Products.
Commodity Trading
Diversify Trading with MCX & NCDEX by Trading in Gold, Silver, Base Metals, Energy, and Agri
Products.
 Margin Trading Funding
Boost your buying power with upto 5X, Buy now Pay Later
Margin Trading Funding
Boost your buying power with upto 5X, Buy now Pay Later
 Algo Trading
Back test, Paper Trade your logic & Automate your strategies with low-latency APIs.
Algo Trading
Back test, Paper Trade your logic & Automate your strategies with low-latency APIs.
 Trading View
Leverage Trading View charts and indicators integrated into your trading platform.
Trading View
Leverage Trading View charts and indicators integrated into your trading platform.
 Advanced Options Trading
Execute multi-leg option strategies with precision and insights.
Advanced Options Trading
Execute multi-leg option strategies with precision and insights.
 Stock Lending & Borrowing
Earn passive income by lending stocks securely through SLB.
Stock Lending & Borrowing
Earn passive income by lending stocks securely through SLB.
 Foreign Portfolio Investment
Enable NRIs and FPIs to invest in Indian markets with ease and compliance.
Foreign Portfolio Investment
Enable NRIs and FPIs to invest in Indian markets with ease and compliance.
 IPO
Invest in upcoming IPOs online with real-time tracking and instant allotment updates.
IPO
Invest in upcoming IPOs online with real-time tracking and instant allotment updates.
 Direct Mutual Funds
0% Commissions by investing in more than +3500 Direct Mutual Fund Scheme.
Direct Mutual Funds
0% Commissions by investing in more than +3500 Direct Mutual Fund Scheme.
 Corporate FDRs
Earn fixed returns with low-risk investments in high-rated corporate fixed deposits.
Corporate FDRs
Earn fixed returns with low-risk investments in high-rated corporate fixed deposits.
 Stocks SIPs
Build long-term wealth with systematic investment plans in top-performing stocks.
Stocks SIPs
Build long-term wealth with systematic investment plans in top-performing stocks.
 Bonds & NCDs
Access secure, fixed-income investments through government and corporate bond offerings.
Bonds & NCDs
Access secure, fixed-income investments through government and corporate bond offerings.
 Depository Services
Safely hold and manage your securities with seamless Demat and DP services with CDSL.
Depository Services
Safely hold and manage your securities with seamless Demat and DP services with CDSL.
 RMoney Quick
Fast, hassle-free trading in one tap.
RMoney Quick
Fast, hassle-free trading in one tap.
 RMoney Rocket
Power-packed platform for active traders.
RMoney Rocket
Power-packed platform for active traders.
 Rocket API
Lightning-fast trading API for developers advanced algo traders.
Rocket API
Lightning-fast trading API for developers advanced algo traders.
 XTS Algo
Smart algo trading software for precision trades.
XTS Algo
Smart algo trading software for precision trades.
 Journey
Tracing our growth and milestones over time.
Journey
Tracing our growth and milestones over time.
 Mission & Vision
Guided by purpose, driven by long-term vision.
Mission & Vision
Guided by purpose, driven by long-term vision.
 Why RMoney Platform
Smart, reliable platform for all investors' needs.
Why RMoney Platform
Smart, reliable platform for all investors' needs.
 Management
Experienced leadership driving strategic financial excellence.
Management
Experienced leadership driving strategic financial excellence.
 Credentials
Certified expertise with trusted industry recognition.
Credentials
Certified expertise with trusted industry recognition.
 Press Release
Latest company news, updates, and announcements.
Press Release
Latest company news, updates, and announcements.
 Testimonials
Real client stories sharing their success journeys.
Testimonials
Real client stories sharing their success journeys.
 7 Reasons to Invest
Top benefits that make investing with us smart.
7 Reasons to Invest
Top benefits that make investing with us smart.
 SEBI Registered Research
Trusted insights backed by SEBI-compliant research.
SEBI Registered Research
Trusted insights backed by SEBI-compliant research.
 Our Technology
Advanced tools enabling efficient online trading.
Our Technology
Advanced tools enabling efficient online trading.
 Blog
Stay updated with expert insights, market trends, and trading strategies through our
informative blogs.
Blog
Stay updated with expert insights, market trends, and trading strategies through our
informative blogs.
 Video
Learn visually with easy-to-understand videos covering trading concepts, tips, and market
analysis.
Video
Learn visually with easy-to-understand videos covering trading concepts, tips, and market
analysis.
 Podcast
Tune in to insightful discussions and expert opinions anytime, anywhere.
Podcast
Tune in to insightful discussions and expert opinions anytime, anywhere.
 Telegram Community
Be part of an active trader community sharing ideas, updates, and market opportunities in
real-time.
Telegram Community
Be part of an active trader community sharing ideas, updates, and market opportunities in
real-time.
 WhatsApp Updates
Get instant alerts, key market updates, and important notifications directly on WhatsApp.
WhatsApp Updates
Get instant alerts, key market updates, and important notifications directly on WhatsApp.
 Financial Calculators
Plan your trades, margins, and returns efficiently with our smart calculation tools.
Financial Calculators
Plan your trades, margins, and returns efficiently with our smart calculation tools.
 Marketplace
Discover curated tools, strategies, and services designed to enhance your trading
experience.
Marketplace
Discover curated tools, strategies, and services designed to enhance your trading
experience.
 Daily Research Reports
Stay ahead with timely market insights, trends, and actionable analysis delivered every day.
Daily Research Reports
Stay ahead with timely market insights, trends, and actionable analysis delivered every day.
 Dedicated Advisory
Get personalized guidance and expert recommendations tailored to your trading goals.
Dedicated Advisory
Get personalized guidance and expert recommendations tailored to your trading goals.
 Research Team
Backed by experienced analysts delivering data-driven insights and market expertise.
Research Team
Backed by experienced analysts delivering data-driven insights and market expertise.
 Research Reports
Access in-depth reports covering stocks, commodities, and market movements to support
informed decisions.
Research Reports
Access in-depth reports covering stocks, commodities, and market movements to support
informed decisions.
 Feedback
Share your suggestions or concerns to help us improve your experience.
Feedback
Share your suggestions or concerns to help us improve your experience.
 Downloads
Access important forms, software, and documents in one place.
Downloads
Access important forms, software, and documents in one place.
 Locate Us
Find the nearest RMoney branch or service center quickly.
Locate Us
Find the nearest RMoney branch or service center quickly.
 Escalation Matrix
Resolve issues faster with our structured support escalation process.
Escalation Matrix
Resolve issues faster with our structured support escalation process.
 Back Office
Log in to view trade reports, ledger, and portfolio statements anytime.
Back Office
Log in to view trade reports, ledger, and portfolio statements anytime.
 Account Modification
Update personal or bank details linked to your trading account.
Account Modification
Update personal or bank details linked to your trading account.
 Fund Transfer
Transfer funds instantly online with quick limit updation to your trading account.
Fund Transfer
Transfer funds instantly online with quick limit updation to your trading account.
 Bank Details
View our registered bank account details for seamless transactions by NEFT, RTGS or IMPS.
Bank Details
View our registered bank account details for seamless transactions by NEFT, RTGS or IMPS.
 RMoney Rocket Web Version
Experience powerful web-based trading with advanced tools for algo traders.
RMoney Rocket Web Version
Experience powerful web-based trading with advanced tools for algo traders.
 Refer & Earn
Invite friends and earn rewards every time they trade with us.
Refer & Earn
Invite friends and earn rewards every time they trade with us.



EQUITY MARKET (23rd July 2026)
By: Naresh Sharma | Date : Jul 23, 26
FII/FPI & DII trading activity on NSE, BSE and MSEI in Capital Market Segment 22nd July 2026
| Category | Value |
| FII/FPI | -418.26Cr |
| DII | -819.20Cr |
| INDIA VIX | 13.04 (-1.96%) |
As of 11:19(IST)
NSE ADVANCE/DECLINE:
| ADVANCE | 1138 |
| DECLINE | 1996 |
As of 14:02(IST)
NIFTY INDEX DAILY REPORT
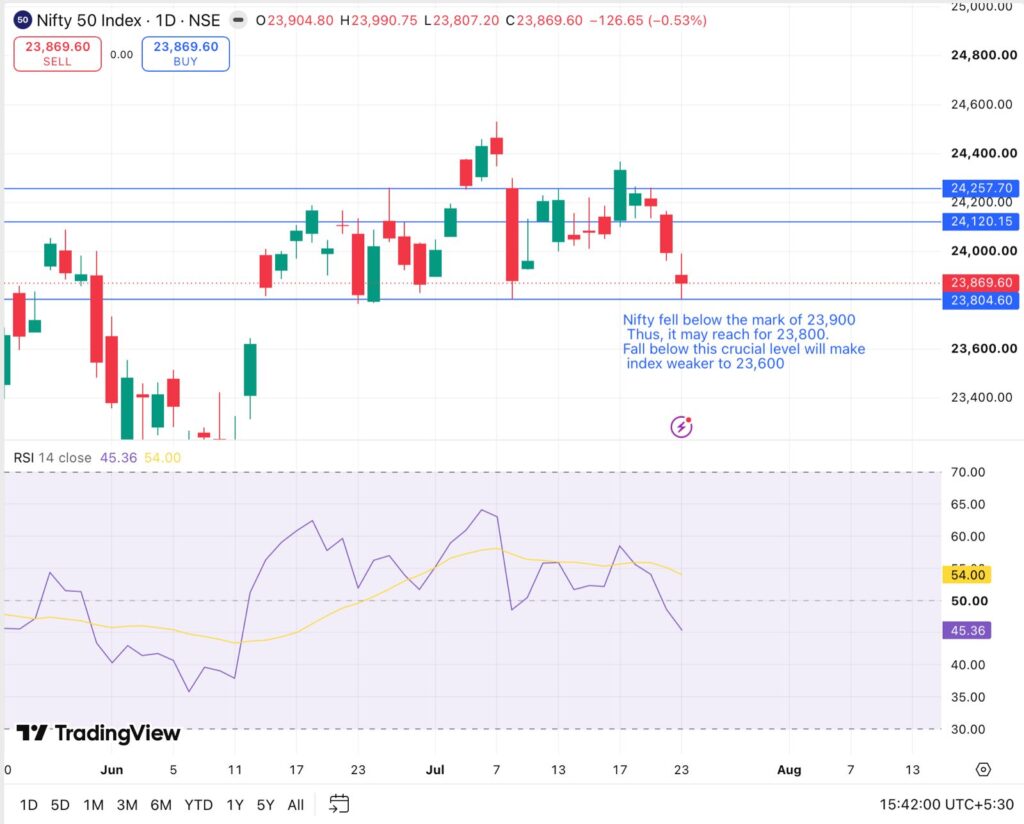
Nifty 50 remained under pressure, continuing its corrective bias toward the psychological support level of 24,000. Overall market sentiment was dampened amid global headwinds, including escalating Middle Eastern geopolitical risks, firming crude oil markets that have reached above the mark of $91, and sustained capital outflow from FIIs. Sectorally , pullbacks in core drivers like Banking, IT, and Healthcare capped gains, but defensive sectors like FMCG and select Auto counters cushioned the downside. On the charts, Nifty tested its crucial intraday support zone near 23,900, with momentum metrics suggesting choppy price action amid impending global macroeconomic catalysts and corporate earnings for Q1 FY27.
Bank Nifty extended its decline as widespread selling hit both private and public sector financial stocks. The index opened with a downward gap at 56,796.95 and tested lower bounds at 56,612 before stabilizing in the 56,700 region, registering a daily decline of nearly 0.94%.Risk appetite was curbed amid rising oil prices due to escalating Middle East tensions, ongoing FPI divestments, and currency pressure. Major index constituents including HDFC Bank, SBI, ICICI Bank, and Axis Bank traded in the red, with the Nifty PSU Bank index dropping 1% in its third consecutive declining session.Technically, the fall below the support of 56,970 may push the index to the level of 56,500–56,800 zone.
Nifty Realty index extended its downward trend, sliding 1.81% to settle the day at 886.70. Following a sharp sell-off in the prior session amid Brent crude prices surging toward $96/barrel amid heightened Middle Eastern geopolitical conflicts. The rate-sensitive real estate sector remained under pressure due to steady inflation and increased bond yields. Particularly, the session coincided with Nifty introducing a revised methodology effective July 24, implementing a 32% sponsor-level weight cap for the related Nifty REITs & Realty index. Technically, the breach of the 900 mark signals short-term weakness, keeping immediate focus on key support levels near 880–882.
The Nifty Energy index traded under significant selling pressure, closing down 0.99% at 39,045.25. Investor sentiment in the sector was dragged down by continuous global macroeconomic instability and increasing Middle Eastern geopolitical tensions, which has drove Brent crude prices past $96 per barrel. The surge in crude oil costs and sustained foreign institutional investor outflows triggered profit-booking across key refinery, gas distribution, and oil exploration. Stock-specific action remained mixed, however, as NTPC Green Energy surged over 6% following positive Q1 FY27 earnings, providing a partial cushion against deeper losses. Technically, the index slipped below its immediate 39,300 pivot shifts short-term support toward the 38,800–38,900 zone amid ongoing market volatility and Q1 corporate results.
NIFTY DAILY CHART
The Nifty fell below the mark of 23,900. The index couldn’t sustain the mark of 24,000 and remained under pressure for the day and reached for the day’s low of 23,807.20. Thus, if the index fails to rise above the mark of 24,000, it may again fall to the mark of 23,800, below this key level index may further weaken to 23,600. Strength in the index can only be witnessed if, index reaches above the mark of 24,100.
| INDICES | CLOSING | %CHANGE | SUPPORT | RESISTANCE |
| NIFTY | 23,869.60 | -0.53% | 23,800 | 24,250 |
| BANK NIFTY | 56,592 | -0.94% | 56,360 | 57,100 |
| SECTORIAL INDICES | ||||
| NIFTY IT | 28,533.55 | -0.06% | 27,890 | 29,500 |
| NIFTY PHARMA | 25,653.55 | -0.38% | 25,300 | 26,102 |
| NIFTY AUTO | 27,520.80 | 0.70% | 26,230 | 27,490 |
| NIFTY REALTY | 886.7 | -1.81% | 880 | 900 |
| NIFTY ENERGY | 39,045.25 | -0.99% | 38,560 | 40,670 |
| NIFTY FMCG | 49,033.20 | -0.41% | 47,650 | 50,520 |
Equity Market Technical Analysis Snapshot: Jul 23rd, 2026
NIFTY50:
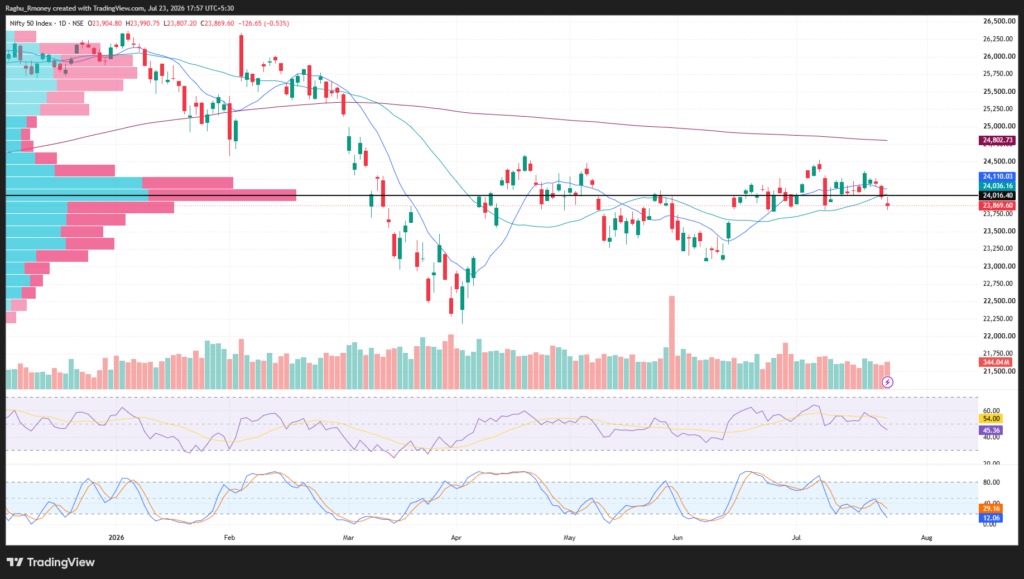
Nifty50 lost -0.53%, opening gap-down at 23904.80 and closing at 23869.60. After the gap-down start, the index tried to test the pivot level of 24000, where it faced selling pressure and saw a fall from that zone to close lower. Technically, the trend remains sideways to bearish, with Nifty trading below its 200-DMA, 11-DMA, and 30-DMA, reflecting persistent weakness across major moving averages. The RSI has slipped to 45.36, indicating fading momentum and sustained downside risk. Immediate resistance is placed at 24000–24100, while support is seen at 23800–23600.
BANKNIFTY:
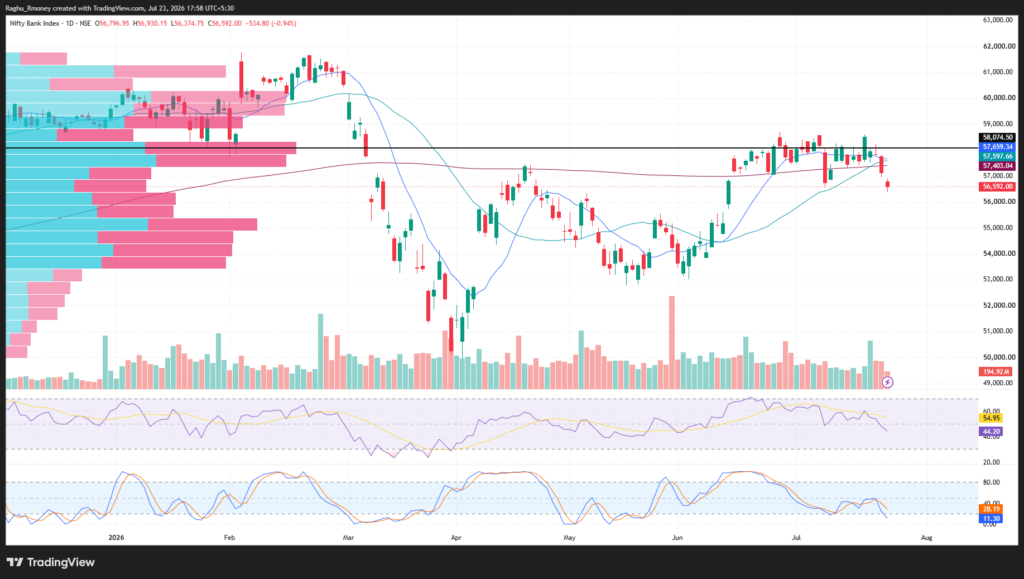
Bank Nifty dropped -0.94%, opening gap-down at 56796.95 and closing near the lower end of the session at 56592.00. The index witnessed a gap-down opening and saw a continuous fall throughout the day to close lower. The trend continues to be sideways to bearish as Bank Nifty trades below its 200-DMA, 30-DMA, and 11-DMA. The RSI at 44.20 reflects ongoing weakness and a lack of immediate buying interest. Immediate resistance is located around 56800–57100, while support is positioned at 56200–55900.
| INDICES | SUPPORT | RESISTANCE | TREND |
| NIFTY50 | 23600 | 24100 | Sideways to Bearish |
| BANK NIFTY | 56800 | 57100 | Sideways to Bearish |
NIFTY MID SELECT:
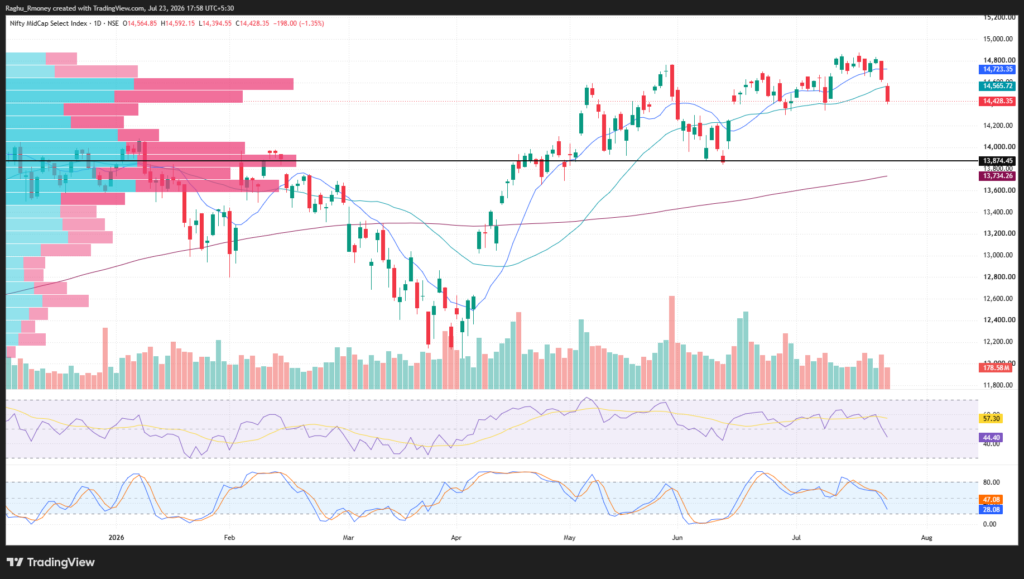
Nifty Mid Select (Midcap Nifty) declined -1.35%, opening at 14564.85 and closing weak at 14428.35 due to persistent profit booking in broader markets. The technical structure remains sideways to bearish, with the index trading above its 200-DMA but below both its 30-DMA and 11-DMA. The RSI at 44.40 indicates deteriorating momentum and pressure on midcaps. Immediate resistance is pegged at 14500–14650, while key support lies at 14350–14200.
NIFTY CHEMICAL:
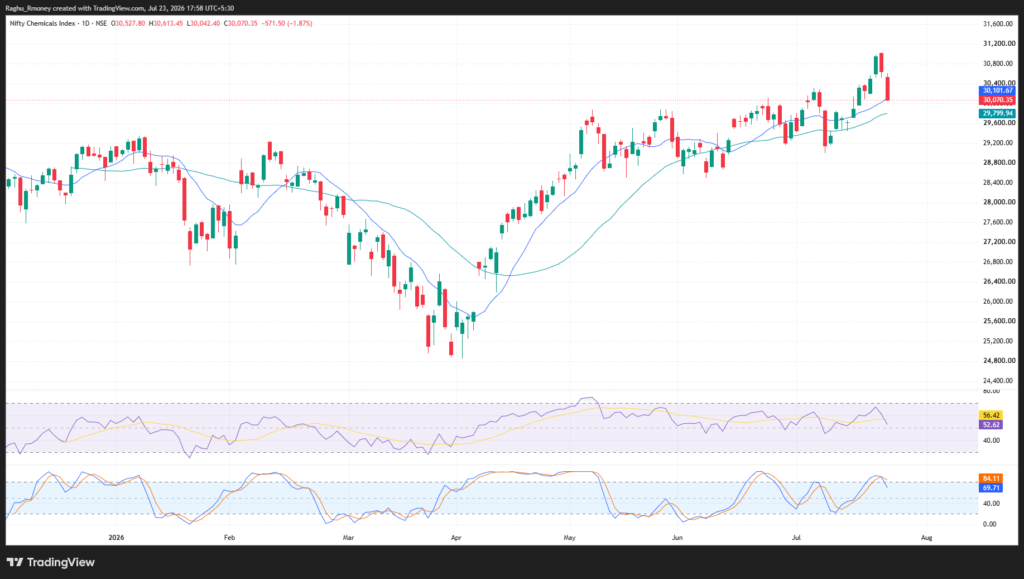
Nifty Chemical fell -1.87%, opening at 30527.80 and closing at 30070.35. This marks a 2-day fall from higher levels, which can be viewed as profit booking from higher zones; traders need to wait for important levels to breach to decide a proper trend, so staying cautious is advised. The trend remains sideways as the index continues to trade above its 200-DMA and 30-DMA, though it has fallen below its 11-DMA. The RSI at 52.62 indicates a neutral momentum setup following the recent pullback. Immediate resistance is seen at 30280–30550, while support is placed at 29850–29500.
| INDICES | SUPPORT | RESISTANCE | TREND |
| NIFTY MID CAP SELECT | 14200 | 14650 | Sideways to Bearish |
| NIFTY CHEMICAL | 29500 | 30550 | Sideways |
Pivot Table:
| PRODUCT | S3 | S2 | S1 | PIVOT | R1 | R2 | R3 |
| NIFTY50 | 23604 | 23706 | 23788 | 23889 | 23971 | 24073 | 24155 |
| BANKNIFTY | 55779 | 56077 | 56334 | 56632 | 56890 | 57188 | 57445 |
| FINNIFTY | 25603 | 25762 | 25877 | 26036 | 26151 | 26309 | 26424 |
| MIDCPNIFTY | 14154 | 14274 | 14351 | 14472 | 14549 | 14669 | 14746 |
| NIFTYNXT50 | 70476 | 71055 | 71448 | 72027 | 72420 | 72999 | 73392 |
FII/FPI & DII trading activity on NSE, BSE and MSEI in Capital Market Segment 23rd July 2026
| Category | Value |
| FII/FPI | -2,999.23Cr |
| DII | +2,947.14Cr |
Disclaimer:
Investment in securities markets is subject to market risks. Please read all related documents carefully before investing. (Our SEBI Reg. No. INH000010335)
For Full Disclaimer: Click Here
Open Demat Account 
Recent Researches



Related Posts
-
Equity Market
Nifty 50 traded with positive bias for the second consecutive trading session and gained277 points,...
-

EQUITY MARKET (09th Oct 2026)
FII/FPI & DII trading activity on NSE, BSE and MSEI in Capital Market Segment: 08th...
-
EQUITY MARKET (11th Aug 2026)
FII/FPI & DII trading activity on NSE, BSE and MSEI in Capital Market Segment: 10th Aug...
-
EQUITY MARKET (04th Sept 2026)
FII/FPI & DII trading activity on NSE, BSE and MSEI in Capital Market Segment 03rd...





Filing Complaints on SCORES (SEBI) – Easy & Quick
- Register on SCORES Portal (SEBI)
- Mandatory details for filing complaints on SCORES:
- Name, PAN, Address, Mobile Number, E-mail ID
- Benefits:
- Effective Communication
- Speedy redressal of the grieva`nces


IT'S TIME TO HAVE SOME FUN!
Your family deserves this time more than we do.
Share happiness with your family today & come back soon. We will be right here.
Investment to ek bahana hai,
humein to khushiyon ko badhana hai.
E-mail
askus@rmoneyindia.com
Customer Care
+91-9568654321



Trade Endlessly with
RMoney
Deep Discount Brokerage Plan
At 999/Monthly
- Dedicated round the clock Advisory Support
- High performance in depth research
- Save more than ₹10,000 brokerage Per Month
- Ultra fast trading app