 Stock Trading
Now trade in ₹9 Per Order or ₹ 999 Per Month Plans.
Stock Trading
Now trade in ₹9 Per Order or ₹ 999 Per Month Plans.
 Future & Options
Access F&O contracts with advanced tools for hedging and speculation.
Future & Options
Access F&O contracts with advanced tools for hedging and speculation.
 Currency Trading
Trade in major currency pairs and manage forex exposure efficiently.
Currency Trading
Trade in major currency pairs and manage forex exposure efficiently.
 Commodity Trading
Diversify Trading with MCX & NCDEX by Trading in Gold, Silver, Base Metals, Energy, and Agri
Products.
Commodity Trading
Diversify Trading with MCX & NCDEX by Trading in Gold, Silver, Base Metals, Energy, and Agri
Products.
 Margin Trading Funding
Boost your buying power with upto 5X, Buy now Pay Later
Margin Trading Funding
Boost your buying power with upto 5X, Buy now Pay Later
 Algo Trading
Back test, Paper Trade your logic & Automate your strategies with low-latency APIs.
Algo Trading
Back test, Paper Trade your logic & Automate your strategies with low-latency APIs.
 Trading View
Leverage Trading View charts and indicators integrated into your trading platform.
Trading View
Leverage Trading View charts and indicators integrated into your trading platform.
 Advanced Options Trading
Execute multi-leg option strategies with precision and insights.
Advanced Options Trading
Execute multi-leg option strategies with precision and insights.
 Stock Lending & Borrowing
Earn passive income by lending stocks securely through SLB.
Stock Lending & Borrowing
Earn passive income by lending stocks securely through SLB.
 Foreign Portfolio Investment
Enable NRIs and FPIs to invest in Indian markets with ease and compliance.
Foreign Portfolio Investment
Enable NRIs and FPIs to invest in Indian markets with ease and compliance.
 IPO
Invest in upcoming IPOs online with real-time tracking and instant allotment updates.
IPO
Invest in upcoming IPOs online with real-time tracking and instant allotment updates.
 Direct Mutual Funds
0% Commissions by investing in more than +3500 Direct Mutual Fund Scheme.
Direct Mutual Funds
0% Commissions by investing in more than +3500 Direct Mutual Fund Scheme.
 Corporate FDRs
Earn fixed returns with low-risk investments in high-rated corporate fixed deposits.
Corporate FDRs
Earn fixed returns with low-risk investments in high-rated corporate fixed deposits.
 Stocks SIPs
Build long-term wealth with systematic investment plans in top-performing stocks.
Stocks SIPs
Build long-term wealth with systematic investment plans in top-performing stocks.
 Bonds & NCDs
Access secure, fixed-income investments through government and corporate bond offerings.
Bonds & NCDs
Access secure, fixed-income investments through government and corporate bond offerings.
 Depository Services
Safely hold and manage your securities with seamless Demat and DP services with CDSL.
Depository Services
Safely hold and manage your securities with seamless Demat and DP services with CDSL.
 RMoney Quick
Fast, hassle-free trading in one tap.
RMoney Quick
Fast, hassle-free trading in one tap.
 RMoney Rocket
Power-packed platform for active traders.
RMoney Rocket
Power-packed platform for active traders.
 Rocket API
Lightning-fast trading API for developers advanced algo traders.
Rocket API
Lightning-fast trading API for developers advanced algo traders.
 XTS Algo
Smart algo trading software for precision trades.
XTS Algo
Smart algo trading software for precision trades.
 Journey
Tracing our growth and milestones over time.
Journey
Tracing our growth and milestones over time.
 Mission & Vision
Guided by purpose, driven by long-term vision.
Mission & Vision
Guided by purpose, driven by long-term vision.
 Why RMoney Platform
Smart, reliable platform for all investors' needs.
Why RMoney Platform
Smart, reliable platform for all investors' needs.
 Management
Experienced leadership driving strategic financial excellence.
Management
Experienced leadership driving strategic financial excellence.
 Credentials
Certified expertise with trusted industry recognition.
Credentials
Certified expertise with trusted industry recognition.
 Press Release
Latest company news, updates, and announcements.
Press Release
Latest company news, updates, and announcements.
 Testimonials
Real client stories sharing their success journeys.
Testimonials
Real client stories sharing their success journeys.
 7 Reasons to Invest
Top benefits that make investing with us smart.
7 Reasons to Invest
Top benefits that make investing with us smart.
 SEBI Registered Research
Trusted insights backed by SEBI-compliant research.
SEBI Registered Research
Trusted insights backed by SEBI-compliant research.
 Our Technology
Advanced tools enabling efficient online trading.
Our Technology
Advanced tools enabling efficient online trading.
 Blog
Stay updated with expert insights, market trends, and trading strategies through our
informative blogs.
Blog
Stay updated with expert insights, market trends, and trading strategies through our
informative blogs.
 Video
Learn visually with easy-to-understand videos covering trading concepts, tips, and market
analysis.
Video
Learn visually with easy-to-understand videos covering trading concepts, tips, and market
analysis.
 Podcast
Tune in to insightful discussions and expert opinions anytime, anywhere.
Podcast
Tune in to insightful discussions and expert opinions anytime, anywhere.
 Telegram Community
Be part of an active trader community sharing ideas, updates, and market opportunities in
real-time.
Telegram Community
Be part of an active trader community sharing ideas, updates, and market opportunities in
real-time.
 WhatsApp Updates
Get instant alerts, key market updates, and important notifications directly on WhatsApp.
WhatsApp Updates
Get instant alerts, key market updates, and important notifications directly on WhatsApp.
 Financial Calculators
Plan your trades, margins, and returns efficiently with our smart calculation tools.
Financial Calculators
Plan your trades, margins, and returns efficiently with our smart calculation tools.
 Marketplace
Discover curated tools, strategies, and services designed to enhance your trading
experience.
Marketplace
Discover curated tools, strategies, and services designed to enhance your trading
experience.
 Daily Research Reports
Stay ahead with timely market insights, trends, and actionable analysis delivered every day.
Daily Research Reports
Stay ahead with timely market insights, trends, and actionable analysis delivered every day.
 Dedicated Advisory
Get personalized guidance and expert recommendations tailored to your trading goals.
Dedicated Advisory
Get personalized guidance and expert recommendations tailored to your trading goals.
 Research Team
Backed by experienced analysts delivering data-driven insights and market expertise.
Research Team
Backed by experienced analysts delivering data-driven insights and market expertise.
 Research Reports
Access in-depth reports covering stocks, commodities, and market movements to support
informed decisions.
Research Reports
Access in-depth reports covering stocks, commodities, and market movements to support
informed decisions.
 Feedback
Share your suggestions or concerns to help us improve your experience.
Feedback
Share your suggestions or concerns to help us improve your experience.
 Downloads
Access important forms, software, and documents in one place.
Downloads
Access important forms, software, and documents in one place.
 Locate Us
Find the nearest RMoney branch or service center quickly.
Locate Us
Find the nearest RMoney branch or service center quickly.
 Escalation Matrix
Resolve issues faster with our structured support escalation process.
Escalation Matrix
Resolve issues faster with our structured support escalation process.
 Back Office
Log in to view trade reports, ledger, and portfolio statements anytime.
Back Office
Log in to view trade reports, ledger, and portfolio statements anytime.
 Account Modification
Update personal or bank details linked to your trading account.
Account Modification
Update personal or bank details linked to your trading account.
 Fund Transfer
Transfer funds instantly online with quick limit updation to your trading account.
Fund Transfer
Transfer funds instantly online with quick limit updation to your trading account.
 Bank Details
View our registered bank account details for seamless transactions by NEFT, RTGS or IMPS.
Bank Details
View our registered bank account details for seamless transactions by NEFT, RTGS or IMPS.
 RMoney Rocket Web Version
Experience powerful web-based trading with advanced tools for algo traders.
RMoney Rocket Web Version
Experience powerful web-based trading with advanced tools for algo traders.
 Refer & Earn
Invite friends and earn rewards every time they trade with us.
Refer & Earn
Invite friends and earn rewards every time they trade with us.



EQUITY MARKET (30th June 2026)
By: Moumita Samanta | Date : Jun 30, 26
FII/FPI & DII trading activity on NSE, BSE and MSEI in Capital Market Segment: 29th June 2026
| Category | Net Value |
|---|---|
| DII | +2,801.45Cr |
| FII/FPI | -1,350.10Cr |
| INDIA VIX | 13.76(+1.10%) |
As of 10:18 (IST)
NSE ADVANCE/DECLINE:
| ADVANCE | 1602 |
| DECLINE | 1330 |
As of 10:19 (IST)
NIFTY INDEX DAILY REPORT
Nifty 50 experienced a volatile but resilient trading session, ultimately managing to reach an intra day high of 24,035.55 but failed to retain the momentum and slipped to settle at the level of 23,865.75 . The market opened under pressure, slipping below the 23,900 mark due to cautious global cues, including geopolitical tensions in the Middle East and ongoing foreign fund outflows. However, strong domestic institutional buying and a steady cooling of the India VIX , dropping at 13.600 helped stabilize sentiment, while broader markets outperformed as mid-cap and small-cap indices notched stronger gains. A minor 0.51% dip in Brent crude prices to $73.53 per barrel provided a favorable macroeconomic buffer that aided the headline index’s afternoon bounce and managed to sustain above the 23,900 mark.
Bank Nifty index underwent a highly erratic and cautious trading session, driven by intense squaring-off and positioning from the monthly derivatives expiry. Banking index commenced Tuesday’s trade on a strong footing at the level of 58,011.95, which also remained the day’s high and later index fell to the intra day low of 57,463.55 amid a steady exodus of foreign institutional investor (FII) capital weighed heavily on private banking stocks, repeatedly challenging the crucial support level near 57,470. Even though a broader market rebound amid 2% drop in the India VIX provided a safety net for the index, Bank Nifty ultimately kept market participants on edge as aggressive call writing clamped down on any meaningful upside.
The real estate sector emerged as a major bright spot, outpacing the broader market as it staged a powerful recovery from the previous session’s downturn. Starting the trading day at 823.25, higher from its previous day’s close of 818.85, the index maintained a steady upside bias to touch a session high of 835.15, before concluding the day near that peak at 829.55 for a robust gain of roughly 1.31%. This decisive rally was largely propelled by fresh local institutional inflows and strategic portfolio adjustments by fund managers ahead of the first-quarter corporate financial disclosures. Due to increased trading volumes in anchor stocks like Godrej Properties and DLF, the realty sector successfully gained during the trading session decoupling the boarder’s index choppiness, expiry-led fluctuations visible across other indices, wrapping up the month with significant structural strength.
NIFTY DAILY CHART
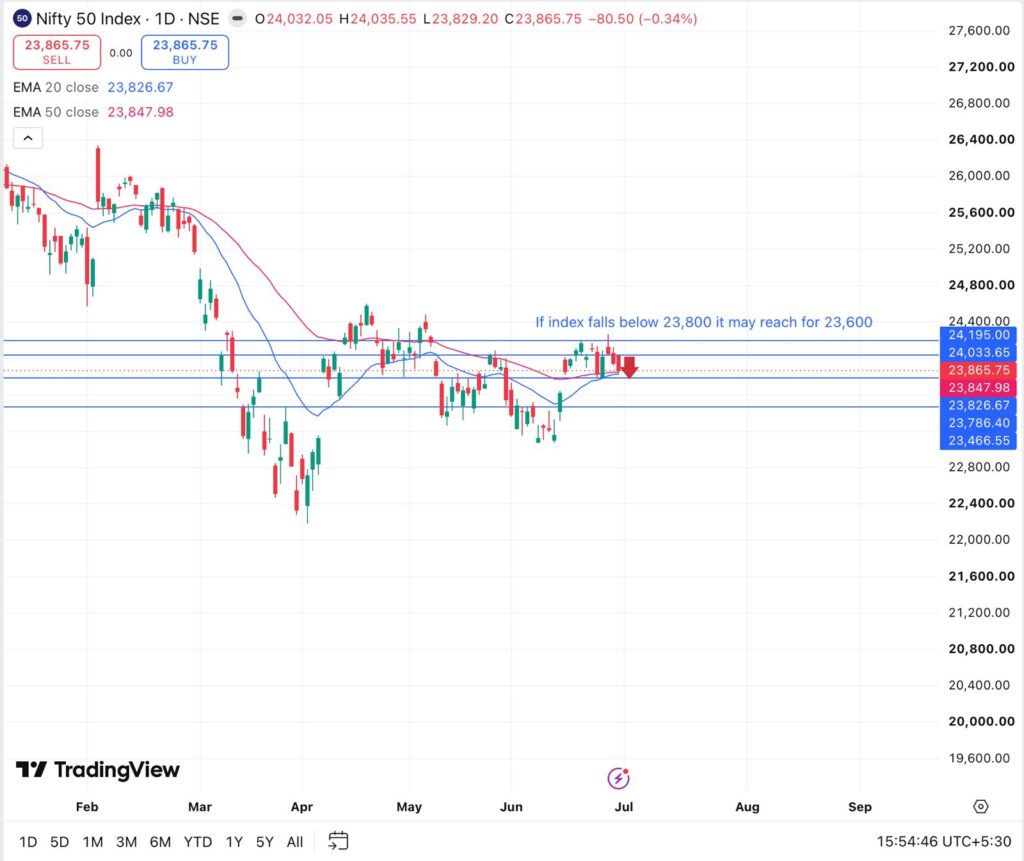
Nifty failed to sustain above the mark of 24,000. Thus the index fell to the intra day low of 23,851.95. The index is also nearing its 20EMA and 50EMA on daily charts at 23,827 and 23, 848, respectively. Thus, if the index falls below the level of 23,850, the int may further weaken towards the level of 23,600.
| NIFTY | 23,865.75 | -0.34% | 23,800 | 24,100 |
| BANK NIFTY | 57,542.90 | -0.32% | 57,100 | 58,250 |
| SECTORIAL INDICES | ||||
| NIFTY IT | 26,299.05 | -2.73% | 26,200 | 27,000 |
| NIFTY PHARMA | 25,326.40 | 0.39% | 24,780 | 25,400 |
| NIFTY AUTO | 26,479.80 | 0.24% | 26,230 | 27,100 |
| NIFTY REALTY | 829.55 | 1.31% | 780 | 830 |
| NIFTY ENERGY | 39,740.50 | 0.06% | 39,510 | 40,670 |
| NIFTY FMCG | 48,794.20 | -0.68% | 47,650 | 49,890 |
POST MARKET BRIEF:
| Nifty 50 | 23865.75(-0.34%) | Nifty Bank | 57542.9(-0.32%) |
| Sensex | 76478.67(-0.33%) | India Vix | 13.6(-0.07%) |
| Nifty50 Gainers | Nifty50 Losers | ||
| ETERNAL | 2.05% | INFY | -4.38% |
| BHARTIARTL | 1.71% | TCS | -3.58% |
| POWERGRID | 1.35% | TECHM | -3.09% |
| NESTLEIND | 1.22% | HCLTECH | -2.96% |
| NTPC | 1.05% | M&M | -2.92% |
Equity Market Technical Analysis Snapshot: Jun 30th, 2026
NIFTY50:
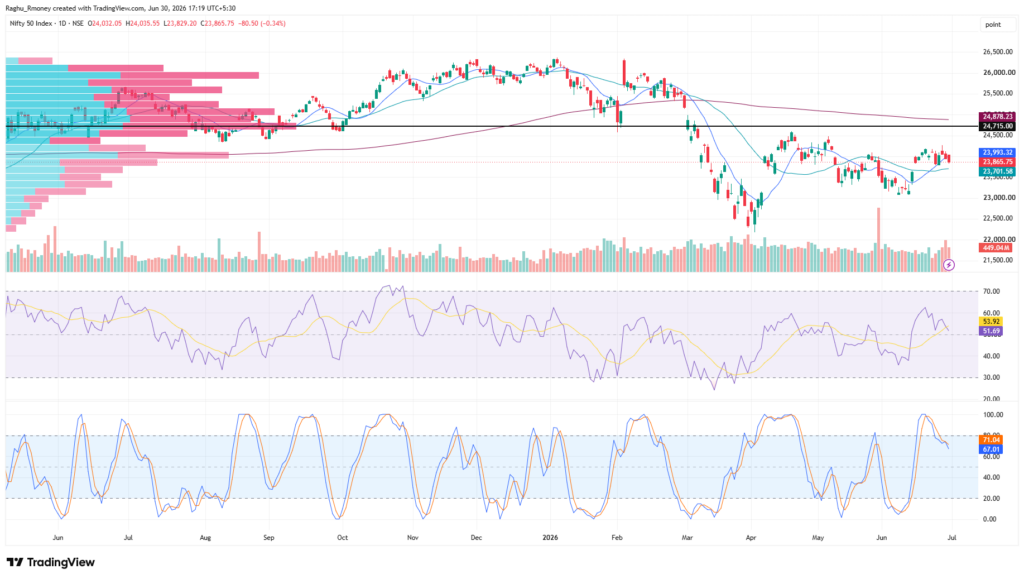
Nifty declined -0.34%, opening gap-up at 24,032.05, but selling pressure emerged immediately after the opening bell. The index slipped below its 11DMA and tested the 23,850 support zone, which held as anticipated, before closing at 23,865.75. The trend remains sideways, but the index is showing signs of a potential bullish reversal as long as key support levels continue to hold. Technically, Nifty is trading below the 200DMA and 11DMA but above the 30DMA, indicating that the medium-term structure remains constructive despite short-term weakness. The RSI at 51.69 suggests neutral momentum with scope for recovery. Immediate resistance is placed at 24,000-24,110, while support is seen at 23,750-23,600. A sustained move above 24,000 could revive bullish momentum, whereas a break below 23,750 may invite fresh selling.
BANKNIFTY:
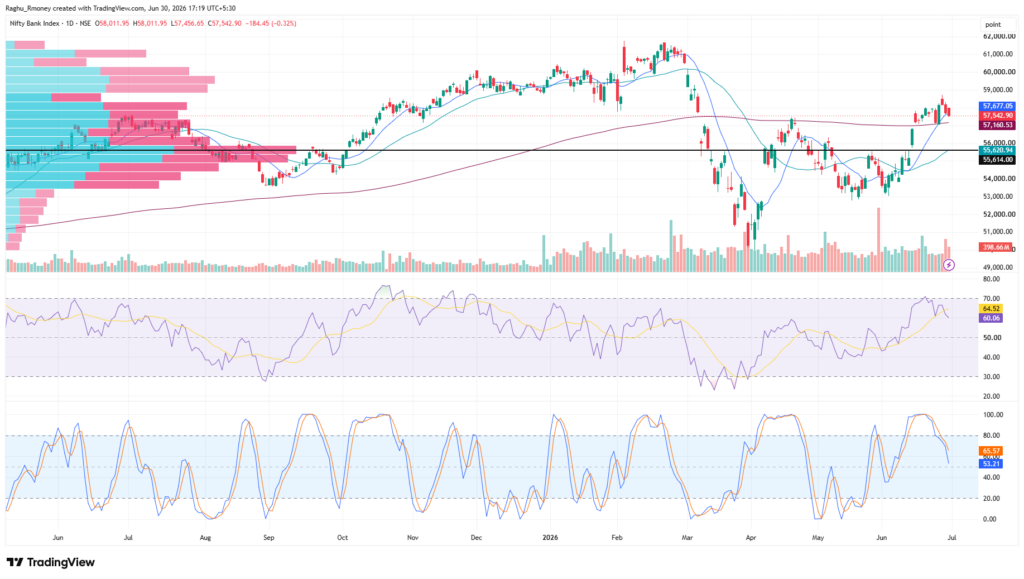
Bank Nifty slipped -0.32%, opening gap-up at 58,011.95 before witnessing broad-based selling through the session. The index fell below its 11DMA and repeatedly found support near the 57,600 level, exactly as anticipated, before closing at 57,542.90. The trend remains sideways, with expectations of a bullish reversal provided the index continues to hold above key support levels. Bank Nifty still trades above its 200DMA and 30DMA but below the 11DMA, indicating that the broader trend remains positive while short-term momentum has weakened. The RSI at 60.06 continues to reflect a healthy underlying structure. Immediate resistance is placed at 58,100-58,450, while support is seen at 57,200-56,950. A decisive move above 58,100 could restore bullish momentum, while a break below 57,200 may trigger additional profit booking.
| INDICES | SUPPORT | RESISTANCE | TREND |
| NIFTY50 | 23750 | 24000 | Sideways to Bullish |
| BANK NIFTY | 57200 | 58100 | Sideways to Bullish |
NIFTY MID SELECT:
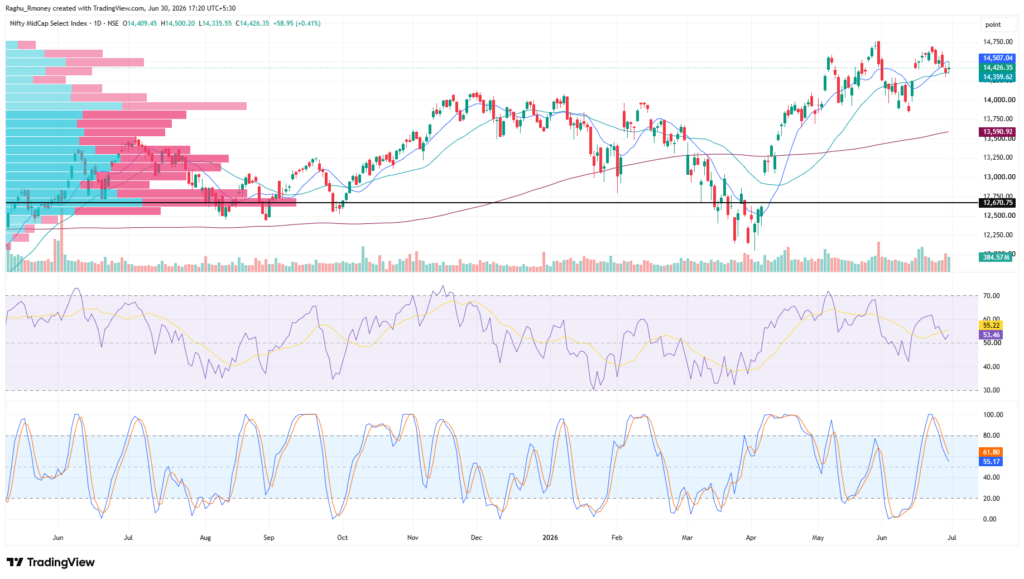
Nifty Mid Select (Midcap Nifty) gained +0.41%, opening gap-up at 14,409.45 before witnessing early selling pressure that pushed the index close to its 30DMA. Buyers emerged near the 14,300 support zone, as anticipated, helping the index reclaim the 30DMA and rally to an intraday high of 14,500.20, precisely near the projected resistance level. The index eventually settled at 14,426.35. The trend remains sideways to bullish as the index continues to trade above its 200DMA and 30DMA, although it remains below the 11DMA, indicating some short-term caution. The RSI at 53.46 suggests stable momentum with room for further upside. Immediate resistance is placed at 14,500-14,600, while support is seen at 14,300-14,210. A decisive breakout above 14,500 could strengthen the ongoing bullish trend.
NIFTY IT:
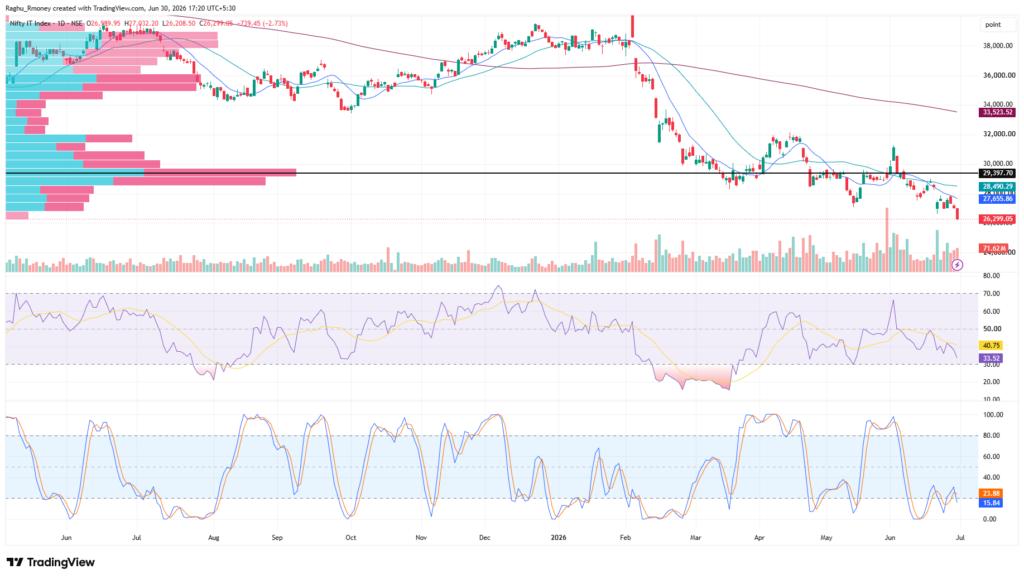
Nifty IT edged lower by -2.73%, opening at 26,989.95 before witnessing sharp selling pressure during the session. The index fell to an intraday low of 26,208.50 before recovering modestly to close at 26,299.05. The trend remains bearish as the index continues to trade below its 200DMA, 30DMA, and 11DMA, reflecting weakness across all major timeframes. The RSI at 33.52 has entered the oversold region, indicating that although the primary trend remains negative, the probability of a short-covering bounce is increasing if support holds. Immediate support is placed at 26,180-25,500, while resistance is seen at 26,650-27,100. Holding above 26,180 could trigger a technical recovery, while a decisive break below this level may lead to further downside.
| INDICES | SUPPORT | RESISTANCE | TREND |
| NIFTY MID CAP SELECT | 14300 | 14500 | Sideways to Bullish |
| NIFTY IT | 26180 | 26650 | Bearish |
Pivot Table:
| PRODUCT | S3 | S2 | S1 | PIVOT | R1 | R2 | R3 |
| NIFTY50 | 23578 | 23704 | 23785 | 23910 | 23991 | 24117 | 24197 |
| BANKNIFTY | 56774 | 57115 | 57329 | 57671 | 57884 | 58226 | 58440 |
| FINNIFTY | 26240 | 26373 | 26464 | 26597 | 26688 | 26821 | 26912 |
| MIDCPNIFTY | 14511 | 14506 | 14421 | 14415 | 14330 | 14324 | 14239 |
| NIFTYNXT50 | 71900 | 71935 | 71647 | 71682 | 71394 | 71429 | 71140 |
Expiry Effect: IT Stocks Crash! Nifty Breaks Below 23,900 | Crucial Support & Resistance Levels
Market Correction Continues! In today’s post-market analysis show, we break down why the Indian stock market closed in the red on June 30, 2026. With Nifty slipping below the 23,900 mark and severe profit-booking witnessed in IT, where is the market heading next? We analyze the crucial support and resistance zones for Nifty 50 and Bank Nifty to prepare you for tomorrow’s trading session.
FII/FPI & DII trading activity on NSE, BSE and MSEI in Capital Market Segment: 30th June 2026
| Category | Net Value |
|---|---|
| DII | +6,842.345Cr |
| FII/FPI | -2,556.75Cr |
Disclaimer:
Investment in securities markets is subject to market risks. Please read all related documents carefully before investing. (Our SEBI Reg. No. INH000010335)
For Full Disclaimer: Click Here
Open Demat Account 
Recent Researches



Related Posts
-

EQUITY MARKET (13th July 2026)
FII/FPI & DII trading activity on NSE, BSE and MSEI in Capital Market Segment: 10th July...
-
Equity Market
Nifty 50 delivered a range-bound performance, closing relatively flat around the 23,907 amid lingering US-Iran...
-
EQUITY MARKET
FII/FPI & DII trading activity on NSE, BSE and MSEI in Capital Market Segment 01st...
-
EQUITY MARKET (15th Jun 2026)
FII/FPI & DII trading activity on NSE, BSE and MSEI in Capital Market Segment 12th...





Filing Complaints on SCORES (SEBI) – Easy & Quick
- Register on SCORES Portal (SEBI)
- Mandatory details for filing complaints on SCORES:
- Name, PAN, Address, Mobile Number, E-mail ID
- Benefits:
- Effective Communication
- Speedy redressal of the grieva`nces


IT'S TIME TO HAVE SOME FUN!
Your family deserves this time more than we do.
Share happiness with your family today & come back soon. We will be right here.
Investment to ek bahana hai,
humein to khushiyon ko badhana hai.
E-mail
askus@rmoneyindia.com
Customer Care
+91-9568654321



Trade Endlessly with
RMoney
Deep Discount Brokerage Plan
At 999/Monthly
- Dedicated round the clock Advisory Support
- High performance in depth research
- Save more than ₹10,000 brokerage Per Month
- Ultra fast trading app